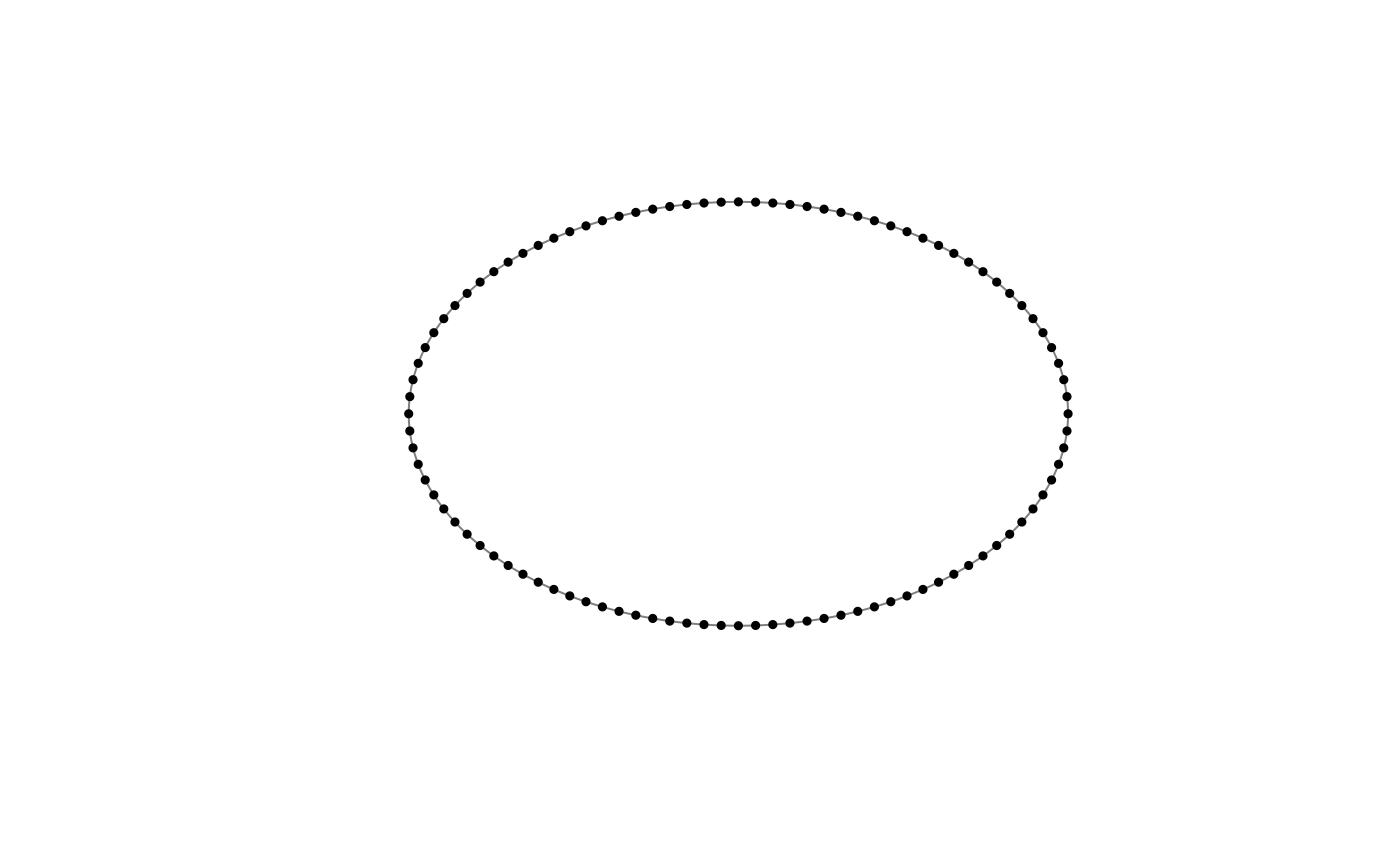
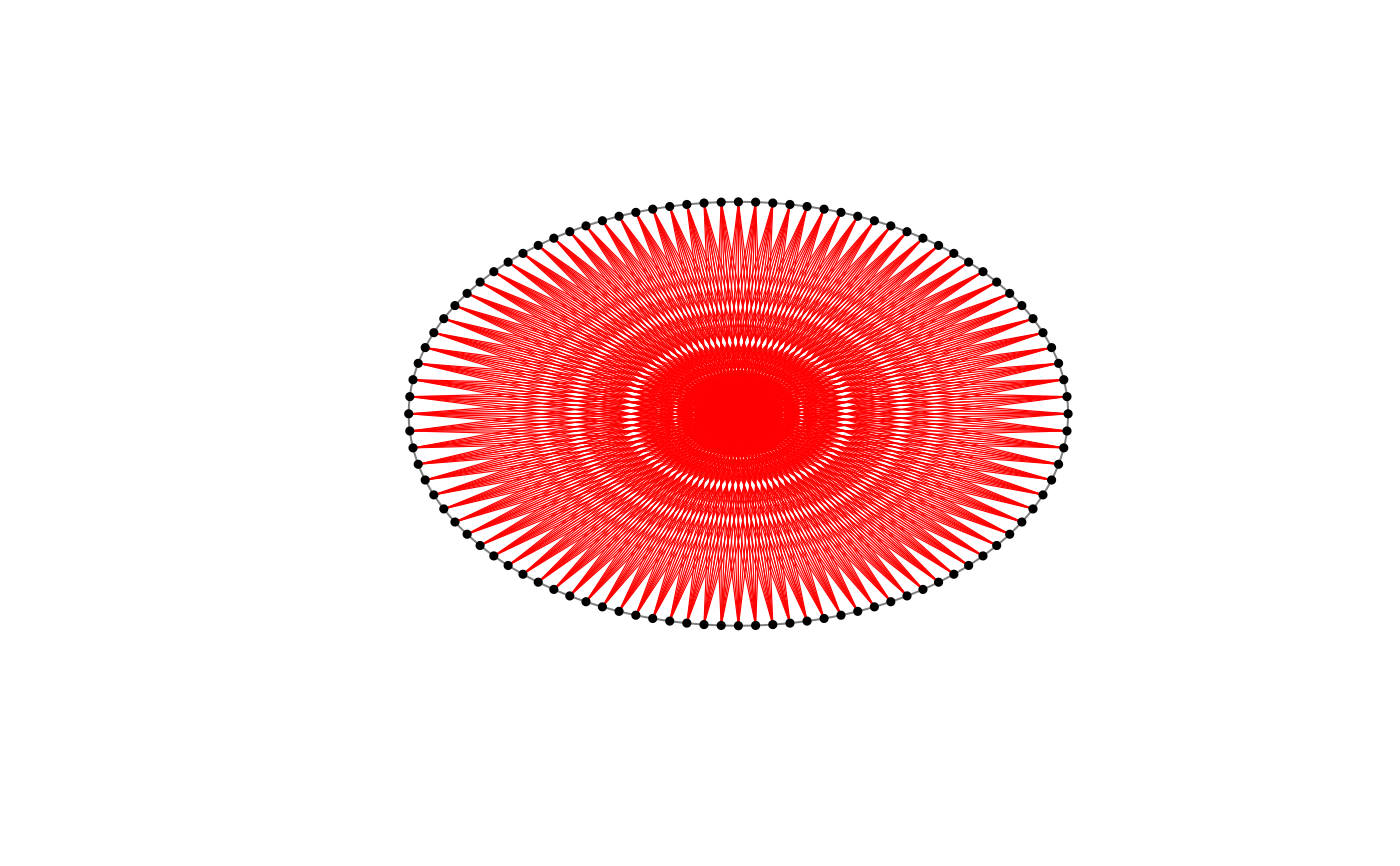
stregion() generates a filled string art pattern from a closed contour.
Pegs are distributed along the contour and connected to approximately opposite
pegs, producing strings that cross the interior of the region.
Usage
stregion(
  n = 100,
  k = 4,
  col = "red",
  lwd = 0.6,
  plot = TRUE,
  show_points = TRUE,
  show_labels = FALSE,
  verbose = FALSE,
  contour = NULL,
  show_strings = TRUE,
  template = FALSE,
  draw_border = TRUE,
  border_col = "grey50",
  border_lwd = 1,
  point_col = "black",
  point_cex = 0.5,
  point_pch = 19,
  point_bg = "white",
  label_cex = 0.6,
  label_col = "black",
  bg = "white",
  main = NULL,
  add = FALSE,
  xlim = NULL,
  ylim = NULL
)
Arguments
- n
Integer. Number of pegs placed along the contour. Must be at least 4.
- k
Integer. Number of sweep offsets used to fill the region. Must be at least 1.
- col
String color passed to
graphics::segments().- lwd
Positive number. Line width used to draw the strings.
- plot
Logical. If
TRUE, draws the figure.- show_points
Logical. If
TRUE, draws the pegs.- show_labels
Logical. If
TRUE, draws peg labels.- verbose
Logical. If
TRUE, prints a short audit to the console.- contour
Optional
data.framewith columnsxandydefining a closed or open polygonal contour. IfNULL, a default ellipse-like contour is used.- show_strings
Logical. If
TRUE, draws the string connections.- template
Logical. If
TRUE, draws only the peg template, without string connections. This is equivalent to settingshow_strings = FALSEandshow_points = TRUE.- draw_border
Logical. If
TRUE, draws the region border.- border_col
Border color.
- border_lwd
Positive number. Border line width.
- point_col
Peg color.
- point_cex
Positive number. Peg size.
- point_pch
Plotting symbol used for pegs.
- point_bg
Peg background color when applicable.
- label_cex
Positive number. Label size.
- label_col
Label color.
- bg
Plot background color.
- main
Optional plot title. If
NULL, no title is displayed.- add
Logical. If
TRUE, adds the string art region to the current graphics device instead of creating a new plot.- xlim, ylim
Optional axis limits used when
plot = TRUEandadd = FALSE.
Value
Invisibly returns a list of class stringart_result with:
- pegs
A
data.framewith columnsindex,x, andy.- connections
A
data.framewith columnsconnection_index,from,to,x_from,y_from,x_to,y_to,length,sweep, andoffset.- total_length
Total string length.
- audit
A character vector with audit information.
- meta
A list with construction metadata.
Details
Unlike circular, elliptical, or triangular modular string art patterns that
usually connect nearby pegs using a fixed additive step, stregion() is
designed to fill a region. It connects each peg to a peg located approximately
on the opposite side of the contour.
The main connection rule is:
to = ((from - 1 + floor(n / 2) + offset) %% n) + 1.
The argument k controls the number of offsets. Each offset produces one
sweep of strings across the interior. Larger values of k create denser
fillings.
Examples
stregion()
 res <- stregion(plot = FALSE)
head(res$pegs)
#> index x y
#> 1 1 1.400000 0.0000000
#> 2 2 1.395363 0.0729174
#> 3 3 1.381724 0.1446961
#> 4 4 1.359638 0.2143431
#> 5 5 1.329918 0.2810981
#> 6 6 1.293385 0.3443908
head(res$connections)
#> connection_index from to x_from y_from x_to y_to length
#> 1 1 1 51 1.400000 0.0000000 -1.400000 -3.781621e-16 2.800000
#> 2 2 2 52 1.395363 0.0729174 -1.395363 -7.291740e-02 2.794534
#> 3 3 3 53 1.381724 0.1446961 -1.381724 -1.446961e-01 2.778559
#> 4 4 4 54 1.359638 0.2143431 -1.359638 -2.143431e-01 2.752859
#> 5 5 5 55 1.329918 0.2810981 -1.329918 -2.810981e-01 2.718600
#> 6 6 6 56 1.293385 0.3443908 -1.293385 -3.443908e-01 2.676900
#> sweep offset
#> 1 1 0
#> 2 1 0
#> 3 1 0
#> 4 1 0
#> 5 1 0
#> 6 1 0
res$total_length
#> [1] 908.1707
custom_contour <- data.frame(
x = c(0, 1, 0.6, -0.6, -1),
y = c(1, 0.2, -0.9, -0.9, 0.2)
)
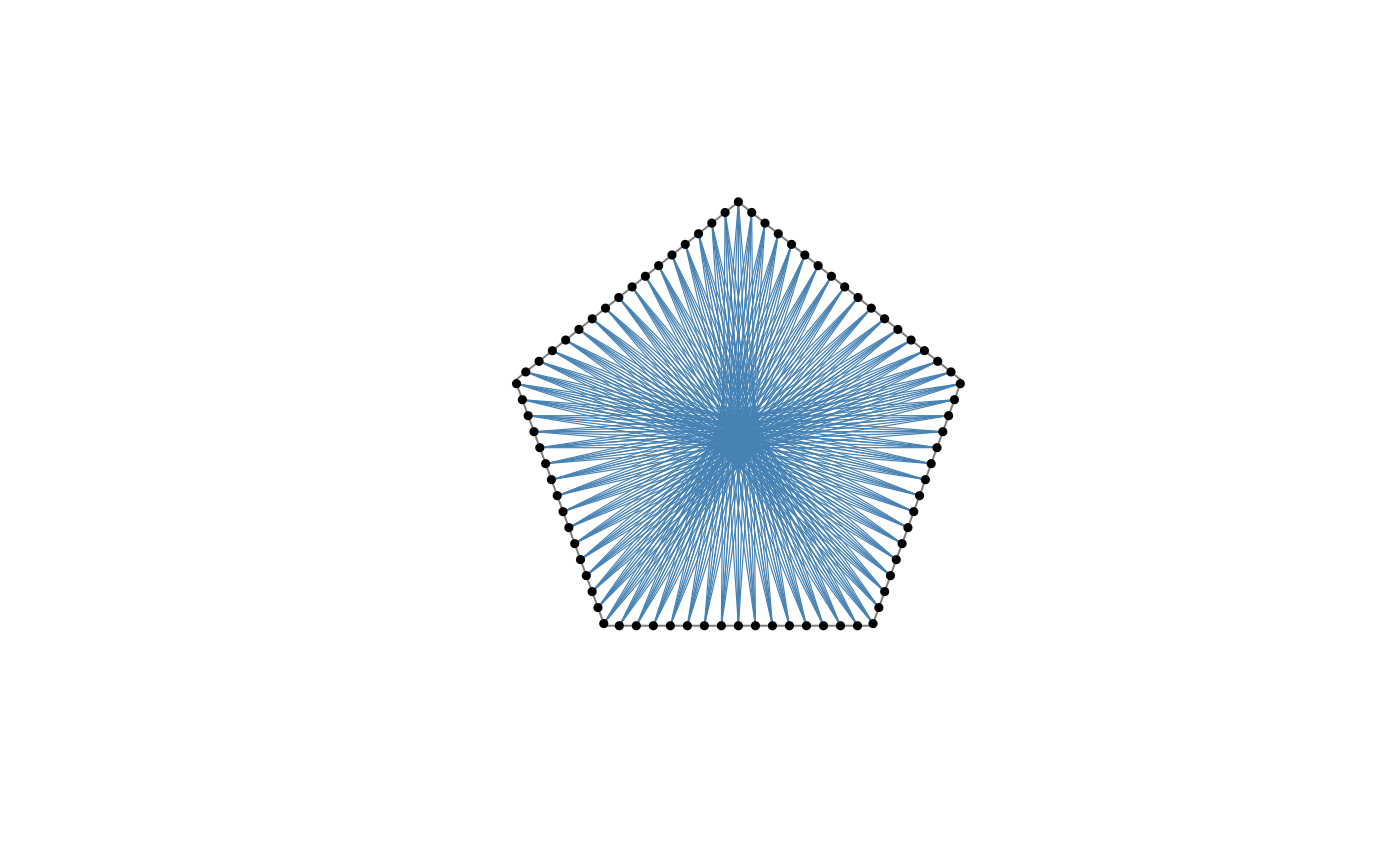
stregion(contour = custom_contour, n = 80, k = 3, col = "steelblue")
res <- stregion(plot = FALSE)
head(res$pegs)
#> index x y
#> 1 1 1.400000 0.0000000
#> 2 2 1.395363 0.0729174
#> 3 3 1.381724 0.1446961
#> 4 4 1.359638 0.2143431
#> 5 5 1.329918 0.2810981
#> 6 6 1.293385 0.3443908
head(res$connections)
#> connection_index from to x_from y_from x_to y_to length
#> 1 1 1 51 1.400000 0.0000000 -1.400000 -3.781621e-16 2.800000
#> 2 2 2 52 1.395363 0.0729174 -1.395363 -7.291740e-02 2.794534
#> 3 3 3 53 1.381724 0.1446961 -1.381724 -1.446961e-01 2.778559
#> 4 4 4 54 1.359638 0.2143431 -1.359638 -2.143431e-01 2.752859
#> 5 5 5 55 1.329918 0.2810981 -1.329918 -2.810981e-01 2.718600
#> 6 6 6 56 1.293385 0.3443908 -1.293385 -3.443908e-01 2.676900
#> sweep offset
#> 1 1 0
#> 2 1 0
#> 3 1 0
#> 4 1 0
#> 5 1 0
#> 6 1 0
res$total_length
#> [1] 908.1707
custom_contour <- data.frame(
x = c(0, 1, 0.6, -0.6, -1),
y = c(1, 0.2, -0.9, -0.9, 0.2)
)
stregion(contour = custom_contour, n = 80, k = 3, col = "steelblue")
 stregion(template = TRUE)