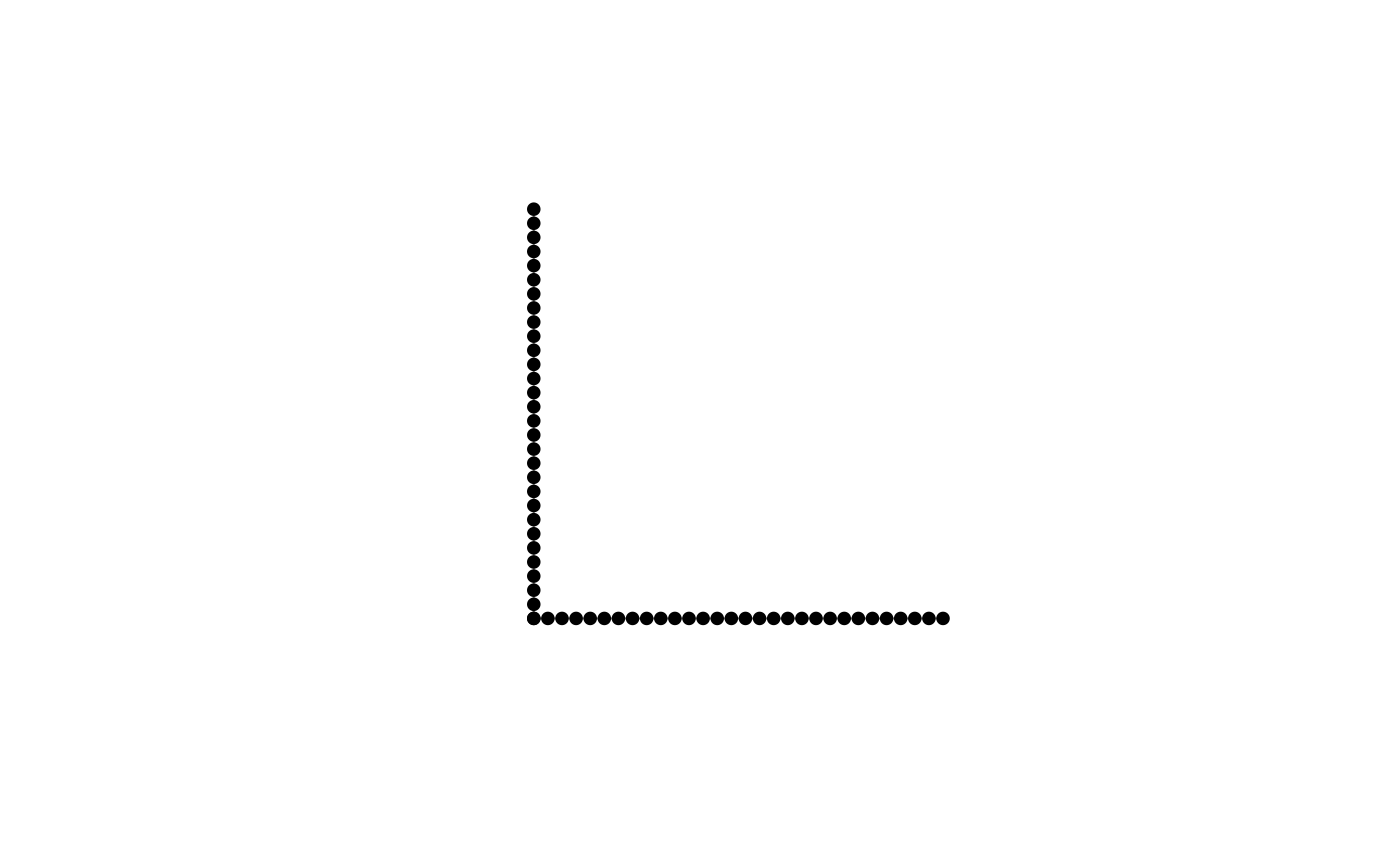
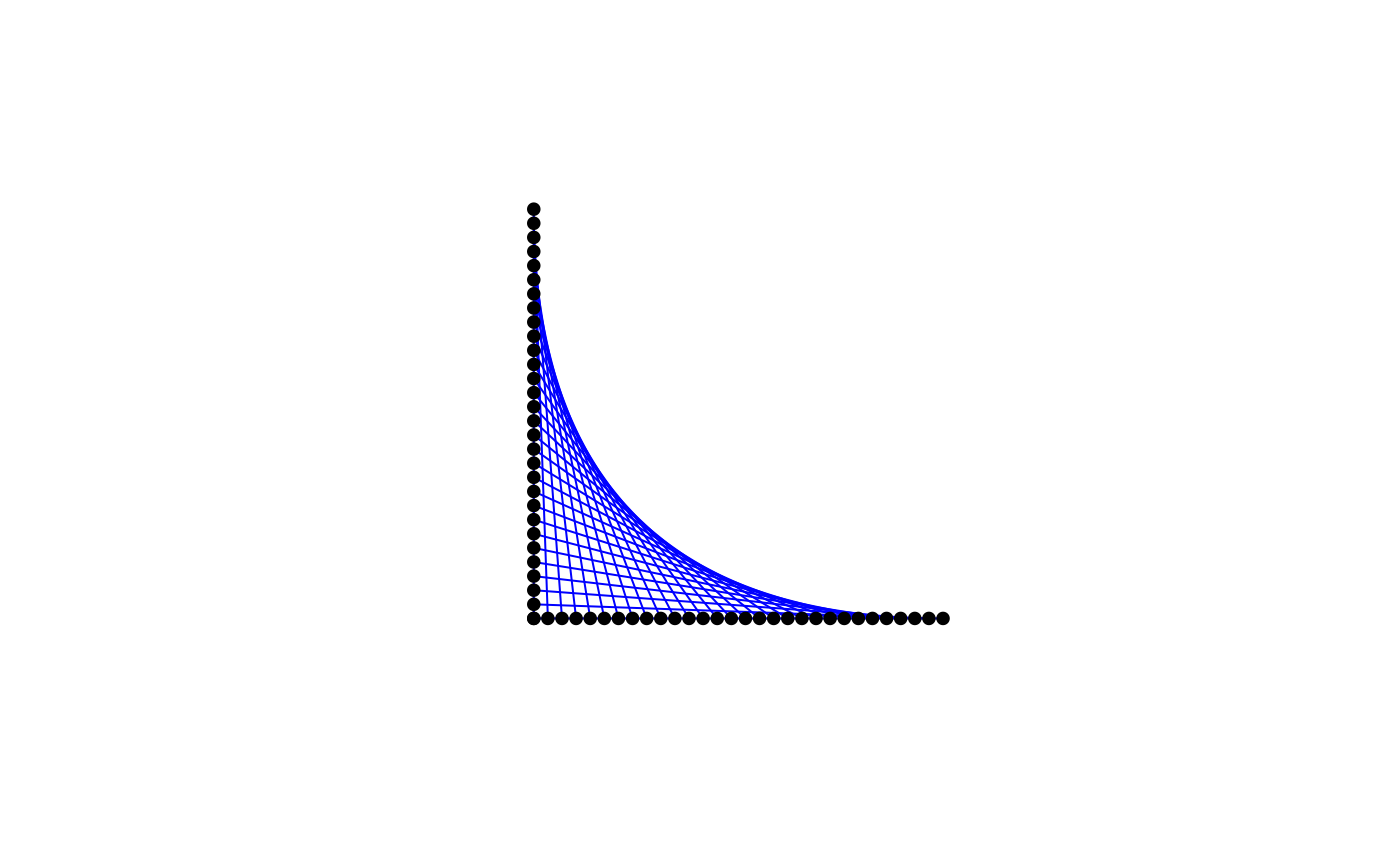
stparabola() generates a classical string art construction on two
perpendicular axes. Pegs are placed on a horizontal axis and on a vertical
axis, and straight strings are drawn between corresponding peg positions.
The resulting family of line segments visually suggests a parabolic envelope.
Usage
stparabola(
  n = 30,
  k = 1,
  col = "blue",
  lwd = 1,
  plot = TRUE,
  show_points = TRUE,
  show_labels = FALSE,
  verbose = FALSE,
  width = 1,
  height = 1,
  show_strings = TRUE,
  template = FALSE,
  show_envelope = FALSE,
  envelope_col = "red",
  envelope_lwd = 1,
  envelope_lty = 2,
  point_col = "black",
  point_cex = 0.8,
  point_pch = 19,
  point_bg = "white",
  label_cex = 0.7,
  label_col = "black",
  border_col = "grey50",
  border_lwd = 1,
  bg = "white",
  main = NULL
)
Arguments
- n
Integer. Number of pegs placed on each axis. Must be at least 3.
- k
Integer. Number of shifted sweeps used in the construction. Must satisfy
1 <= k <= n - 1. The classical construction is obtained withk = 1.- col
String color passed to
graphics::segments().- lwd
Positive number. Line width used to draw the strings.
- plot
Logical. If
TRUE, draws the figure.- show_points
Logical. If
TRUE, draws the pegs.- show_labels
Logical. If
TRUE, draws peg labels.- verbose
Logical. If
TRUE, prints a short audit to the console.- width
Positive number. Length of the horizontal axis.
- height
Positive number. Length of the vertical axis.
- show_strings
Logical. If
TRUE, draws the string connections.- template
Logical. If
TRUE, draws only the peg template, without string connections. This is equivalent to settingshow_strings = FALSEandshow_points = TRUE.- show_envelope
Logical. If
TRUE, draws the theoretical envelope of the classical construction.- envelope_col
Color used for the theoretical envelope.
- envelope_lwd
Positive number. Line width used for the envelope.
- envelope_lty
Line type used for the envelope.
- point_col
Peg color.
- point_cex
Positive number. Peg size.
- point_pch
Plotting symbol used for pegs.
- point_bg
Peg background color when applicable.
- label_cex
Positive number. Label size.
- label_col
Label color.
- border_col
Axis color.
- border_lwd
Positive number. Axis line width.
- bg
Plot background color.
- main
Optional plot title. If
NULL, no title is displayed.
Value
Invisibly returns a list of class stringart_result with:
- pegs
A
data.framewith columnsindex,x,y,axis, andlocal_index.- connections
A
data.framewith columnsconnection_index,from,to,x_from,y_from,x_to,y_to,length,sweep,offset,local_from, andlocal_to.- total_length
Total string length.
- audit
A character vector with audit information.
- meta
A list with construction metadata.
Details
This is one of the most classical string art constructions. Pegs are placed
on two perpendicular axes. In the basic case, the peg at position i on the
horizontal axis is connected to the peg at position i on the vertical axis,
where the vertical axis is indexed from top to bottom.
For k = 1, the construction corresponds to the standard family of segments
joining points (t, 0) and (0, 1 - t), after scaling by width and
height. Its ideal envelope satisfies
sqrt(x / width) + sqrt(y / height) = 1.
For k > 1, the function adds shifted sweeps of the same construction,
producing denser string art patterns while preserving the same pedagogical
idea of a family of straight lines generating a curved envelope.
Examples
stparabola()
 res <- stparabola(plot = FALSE)
head(res$pegs)
#> index x y axis local_index
#> 1 1 0.00000000 0 horizontal 1
#> 2 2 0.03448276 0 horizontal 2
#> 3 3 0.06896552 0 horizontal 3
#> 4 4 0.10344828 0 horizontal 4
#> 5 5 0.13793103 0 horizontal 5
#> 6 6 0.17241379 0 horizontal 6
head(res$connections)
#> connection_index from to x_from y_from x_to y_to length sweep
#> 1 1 1 31 0.00000000 0 0 1.0000000 1.0000000 1
#> 2 2 2 32 0.03448276 0 0 0.9655172 0.9661328 1
#> 3 3 3 33 0.06896552 0 0 0.9310345 0.9335853 1
#> 4 4 4 34 0.10344828 0 0 0.8965517 0.9025002 1
#> 5 5 5 35 0.13793103 0 0 0.8620690 0.8730337 1
#> 6 6 6 36 0.17241379 0 0 0.8275862 0.8453552 1
#> offset local_from local_to
#> 1 0 1 1
#> 2 0 2 2
#> 3 0 3 3
#> 4 0 4 4
#> 5 0 5 5
#> 6 0 6 6
res$total_length
#> [1] 24.54251
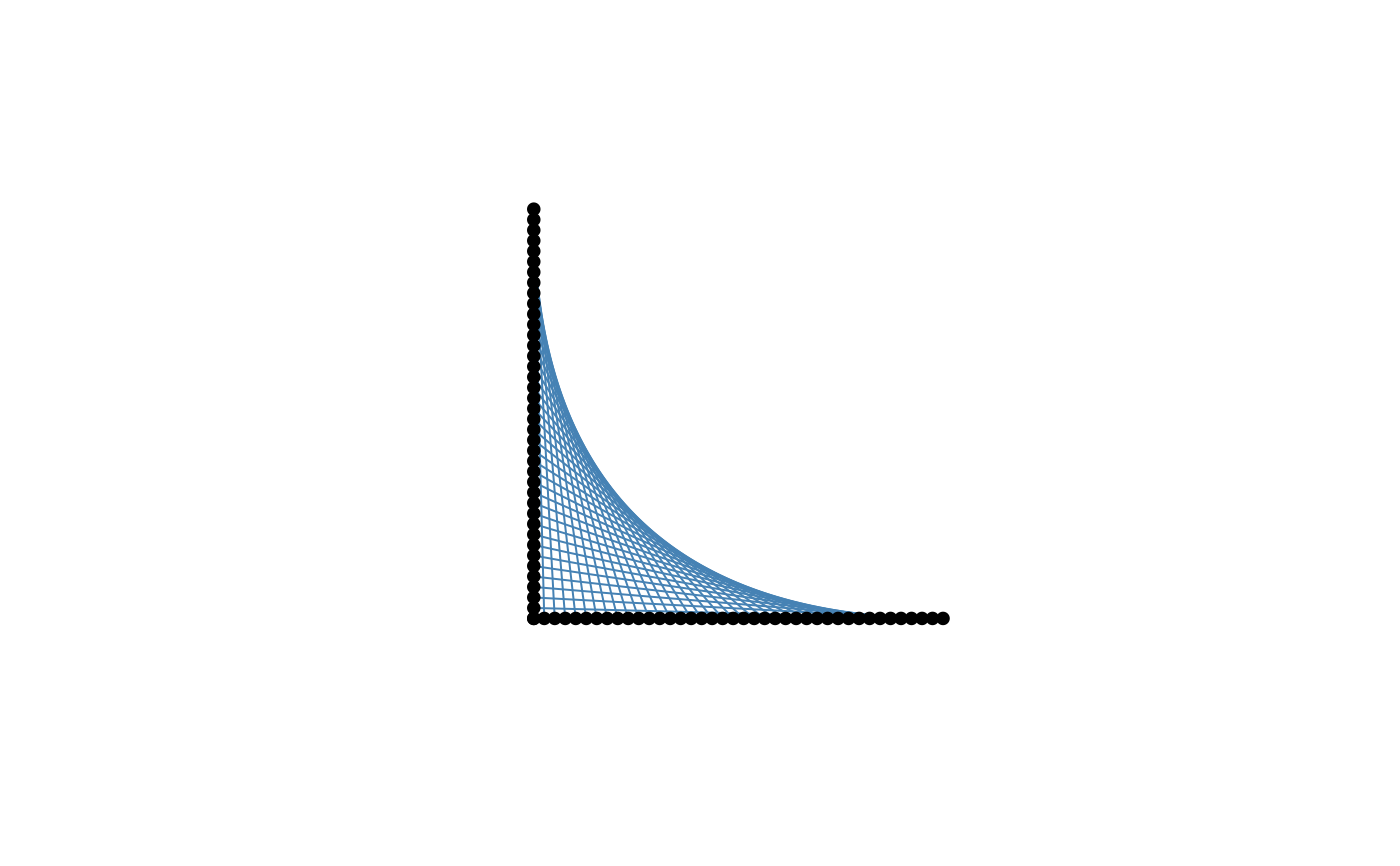
stparabola(n = 40, k = 1, col = "steelblue", lwd = 1)
res <- stparabola(plot = FALSE)
head(res$pegs)
#> index x y axis local_index
#> 1 1 0.00000000 0 horizontal 1
#> 2 2 0.03448276 0 horizontal 2
#> 3 3 0.06896552 0 horizontal 3
#> 4 4 0.10344828 0 horizontal 4
#> 5 5 0.13793103 0 horizontal 5
#> 6 6 0.17241379 0 horizontal 6
head(res$connections)
#> connection_index from to x_from y_from x_to y_to length sweep
#> 1 1 1 31 0.00000000 0 0 1.0000000 1.0000000 1
#> 2 2 2 32 0.03448276 0 0 0.9655172 0.9661328 1
#> 3 3 3 33 0.06896552 0 0 0.9310345 0.9335853 1
#> 4 4 4 34 0.10344828 0 0 0.8965517 0.9025002 1
#> 5 5 5 35 0.13793103 0 0 0.8620690 0.8730337 1
#> 6 6 6 36 0.17241379 0 0 0.8275862 0.8453552 1
#> offset local_from local_to
#> 1 0 1 1
#> 2 0 2 2
#> 3 0 3 3
#> 4 0 4 4
#> 5 0 5 5
#> 6 0 6 6
res$total_length
#> [1] 24.54251
stparabola(n = 40, k = 1, col = "steelblue", lwd = 1)
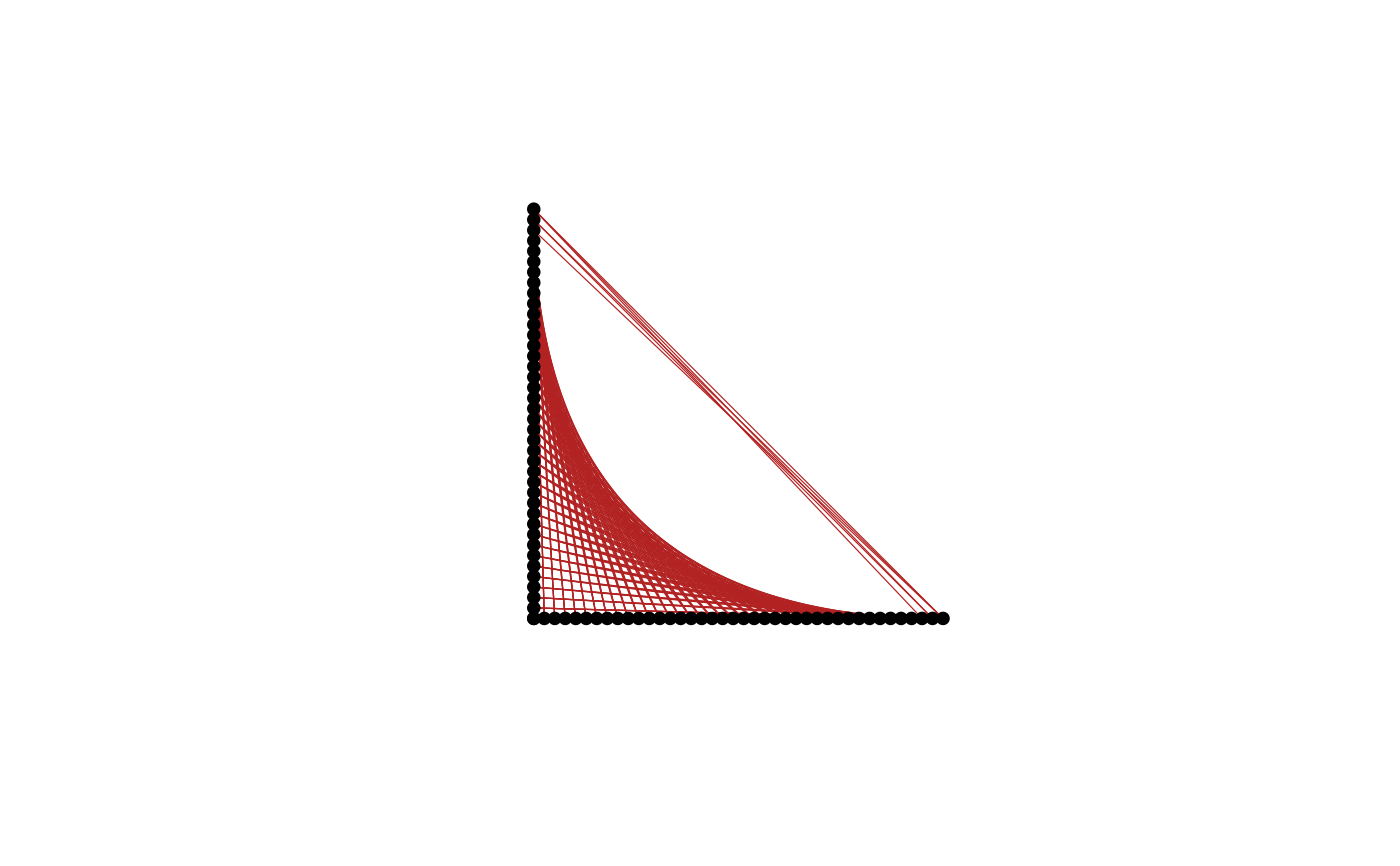
 stparabola(n = 40, k = 4, col = "firebrick", lwd = 0.6)
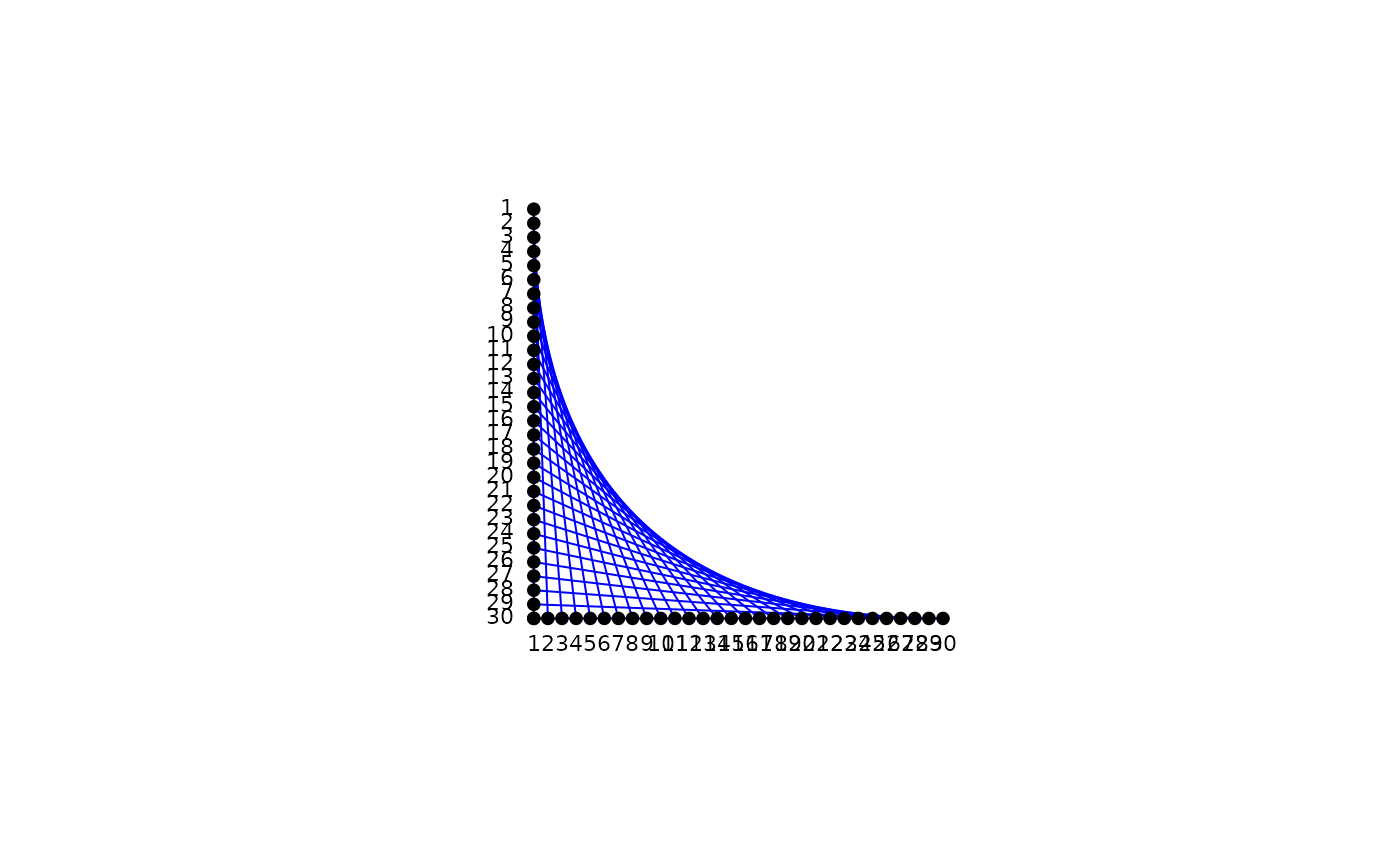
 stparabola(show_points = TRUE, show_labels = TRUE)
 stparabola(template = TRUE)