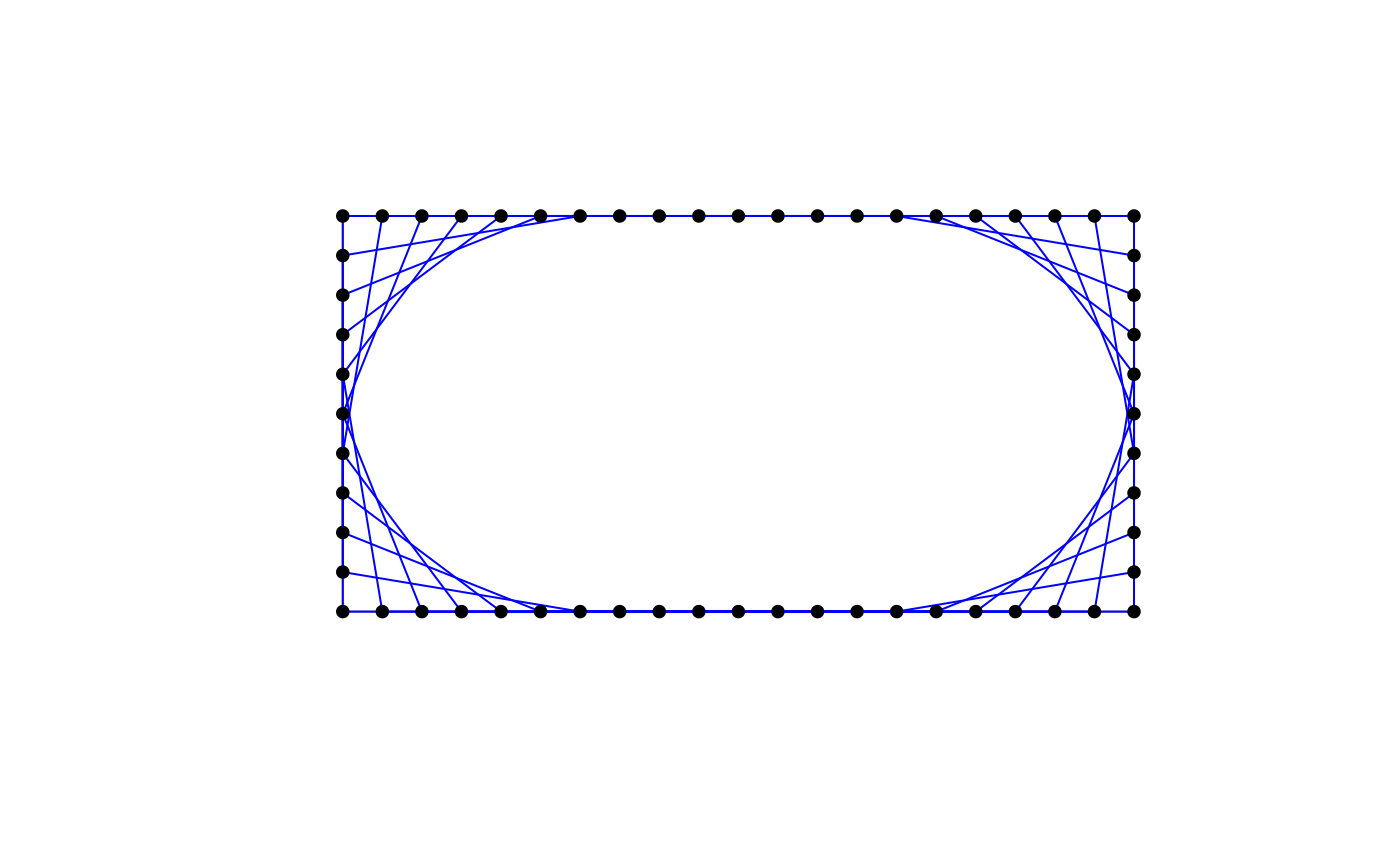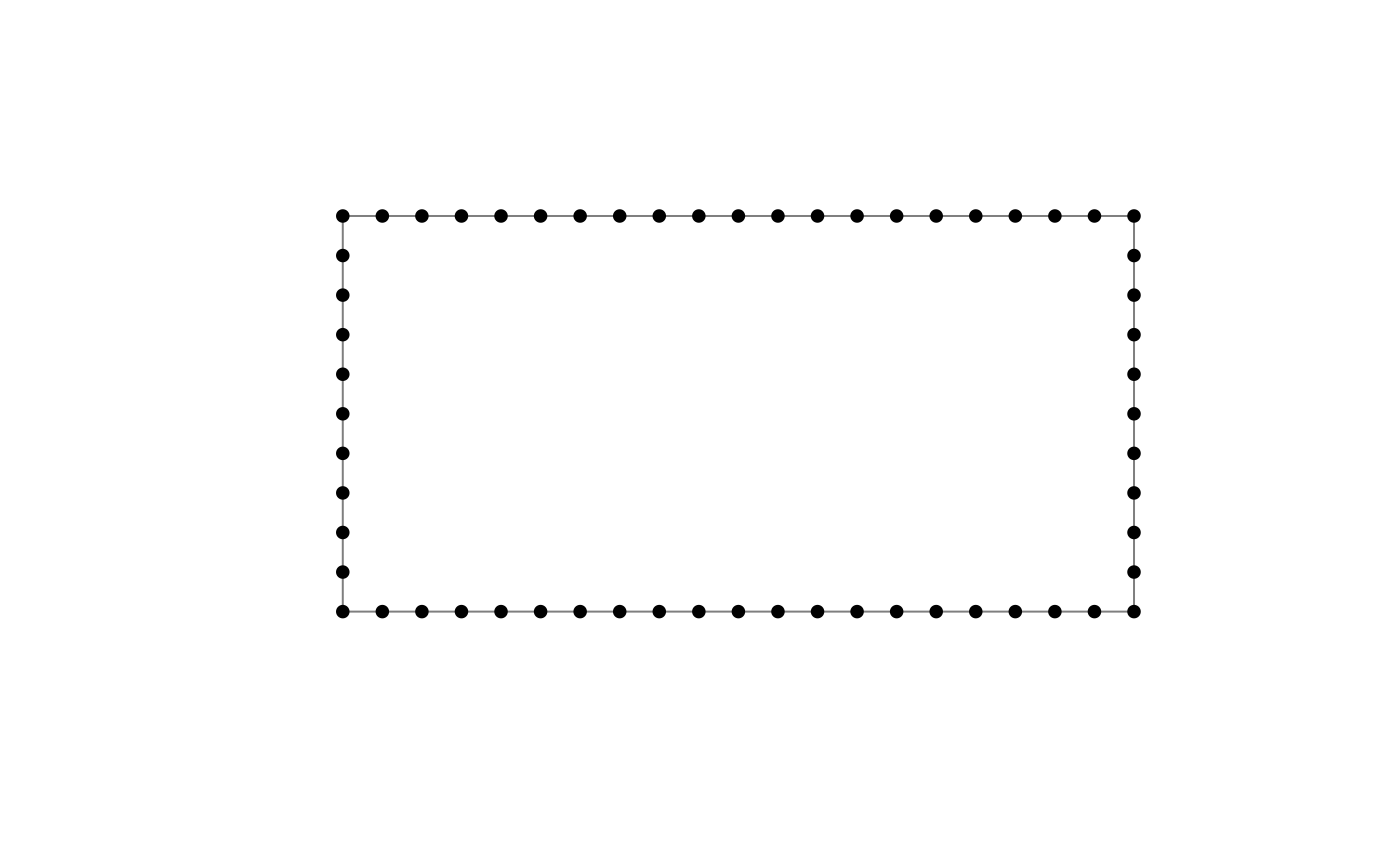
stgrid() generates string art by placing pegs uniformly along the boundary
of a rectangle and connecting them using an additive modular rule.
Usage
stgrid(
  n = 60,
  k = 7,
  col = "blue",
  lwd = 1,
  plot = TRUE,
  show_points = TRUE,
  show_labels = FALSE,
  verbose = FALSE,
  width = 2,
  height = 1,
  rotate = 0,
  show_strings = TRUE,
  template = FALSE,
  border_col = "grey50",
  border_lwd = 1,
  point_col = "black",
  point_cex = 0.8,
  point_pch = 19,
  point_bg = "white",
  label_cex = 0.7,
  label_col = "black",
  bg = "white",
  main = NULL
)
Arguments
- n
Integer. Number of pegs placed on the rectangle boundary. Must be at least 4.
- k
Integer. Additive modular step used in the connection rule. Must satisfy
1 <= k <= n - 1.- col
String color passed to
graphics::segments().- lwd
Positive number. Line width used to draw the strings.
- plot
Logical. If
TRUE, draws the figure.- show_points
Logical. If
TRUE, draws the pegs.- show_labels
Logical. If
TRUE, draws peg labels.- verbose
Logical. If
TRUE, prints a short audit to the console.- width
Positive number. Rectangle width.
- height
Positive number. Rectangle height.
- rotate
Numeric. Rotation angle in radians.
- show_strings
Logical. If
TRUE, draws the string connections.- template
Logical. If
TRUE, draws only the peg template.- border_col
Rectangle border color.
- border_lwd
Positive number. Border line width.
- point_col
Peg color.
- point_cex
Positive number. Peg size.
- point_pch
Plotting symbol used for pegs.
- point_bg
Peg background color when applicable.
- label_cex
Positive number. Label size.
- label_col
Label color.
- bg
Plot background color.
- main
Optional plot title.