stcircle() creates a circular String Art figure by placing equally spaced
pegs on a circle and connecting each peg to another peg using an additive
modular step.
Usage
stcircle(
  n = 30,
  k = 5,
  col = "blue",
  lwd = 1,
  plot = TRUE,
  show_points = TRUE,
  show_labels = FALSE,
  verbose = FALSE,
  r = 1,
  show_strings = TRUE,
  template = FALSE,
  point_col = "black",
  point_cex = 0.8,
  point_pch = 19,
  point_bg = "white",
  label_cex = 0.7,
  label_col = "black",
  border_col = "grey50",
  border_lwd = 1,
  main = NULL
)
Arguments
- n
Integer. Number of pegs on the circle. Defaults to
30.- k
Integer. Additive modular step used to define the connections. Defaults to
5.- col
String color used to draw the segments. Defaults to
"blue".- lwd
Positive number. Line width of the string segments. Defaults to
1.- plot
Logical. If
TRUE, the figure is drawn using base R graphics.- show_points
Logical. If
TRUE, the pegs are shown.- show_labels
Logical. If
TRUE, peg labels are shown.- verbose
Logical. If
TRUE, an audit summary is printed to the console.- r
Positive number. Radius of the circle. Defaults to
1.- show_strings
Logical. If
TRUE, string segments are drawn.- template
Logical. If
TRUE, only the peg template is drawn. This setsshow_strings = FALSEandshow_points = TRUEinternally.- point_col
Color of the pegs.
- point_cex
Positive number. Size of the pegs.
- point_pch
Plotting symbol used for the pegs.
- point_bg
Background color of the pegs when the plotting symbol allows filling.
- label_cex
Positive number. Size of the peg labels.
- label_col
Color of the peg labels.
- border_col
Color of the circular border.
- border_lwd
Positive number. Line width of the circular border.
- main
Character string. Plot title. If
NULL, a default title is used.
Value
Invisibly returns a list with the following elements:
- pegs
A data frame with columns
index,x, andy.- connections
A data frame with columns
connection_index,from,to,x_from,y_from,x_to,y_to, andlength.- total_length
Total string length.
- audit
Character vector with an audit summary.
- meta
List with metadata about the construction.
Details
Pegs are numbered from 1 to n counterclockwise, starting at (r, 0).
For each peg i, the connected peg is defined by
$$j = ((i + k - 1) \bmod n) + 1.$$
When gcd(n, k) = 1, the rule creates a single cycle passing through all
pegs. When gcd(n, k) > 1, the figure is decomposed into independent cycles.
Examples
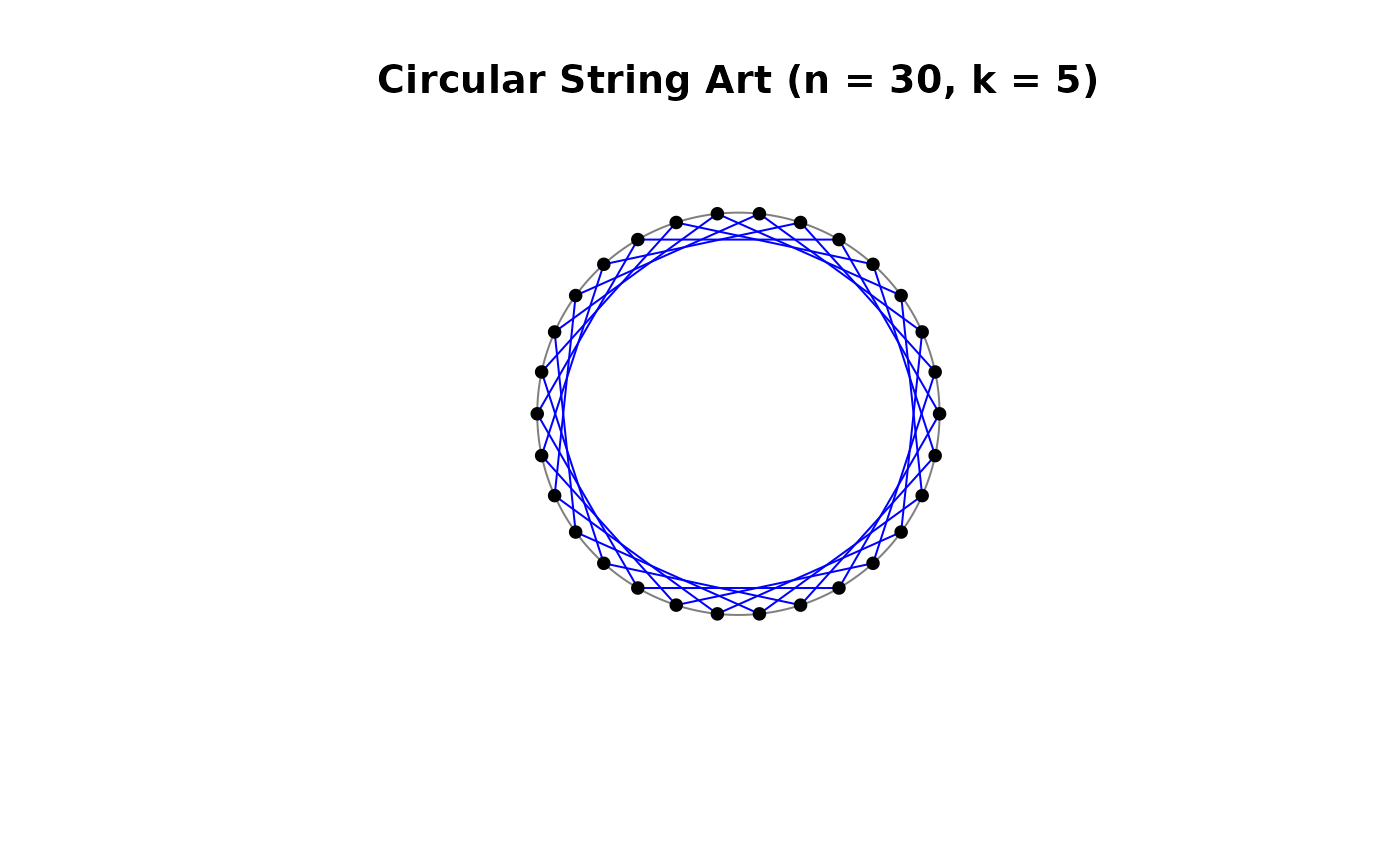
stcircle()
 res <- stcircle(plot = FALSE)
res$total_length
#> [1] 30
head(res$connections)
#> connection_index from to x_from y_from x_to y_to length
#> 1 1 1 6 1.0000000 0.0000000 0.5000000 0.8660254 1
#> 2 2 2 7 0.9781476 0.2079117 0.3090170 0.9510565 1
#> 3 3 3 8 0.9135455 0.4067366 0.1045285 0.9945219 1
#> 4 4 4 9 0.8090170 0.5877853 -0.1045285 0.9945219 1
#> 5 5 5 10 0.6691306 0.7431448 -0.3090170 0.9510565 1
#> 6 6 6 11 0.5000000 0.8660254 -0.5000000 0.8660254 1
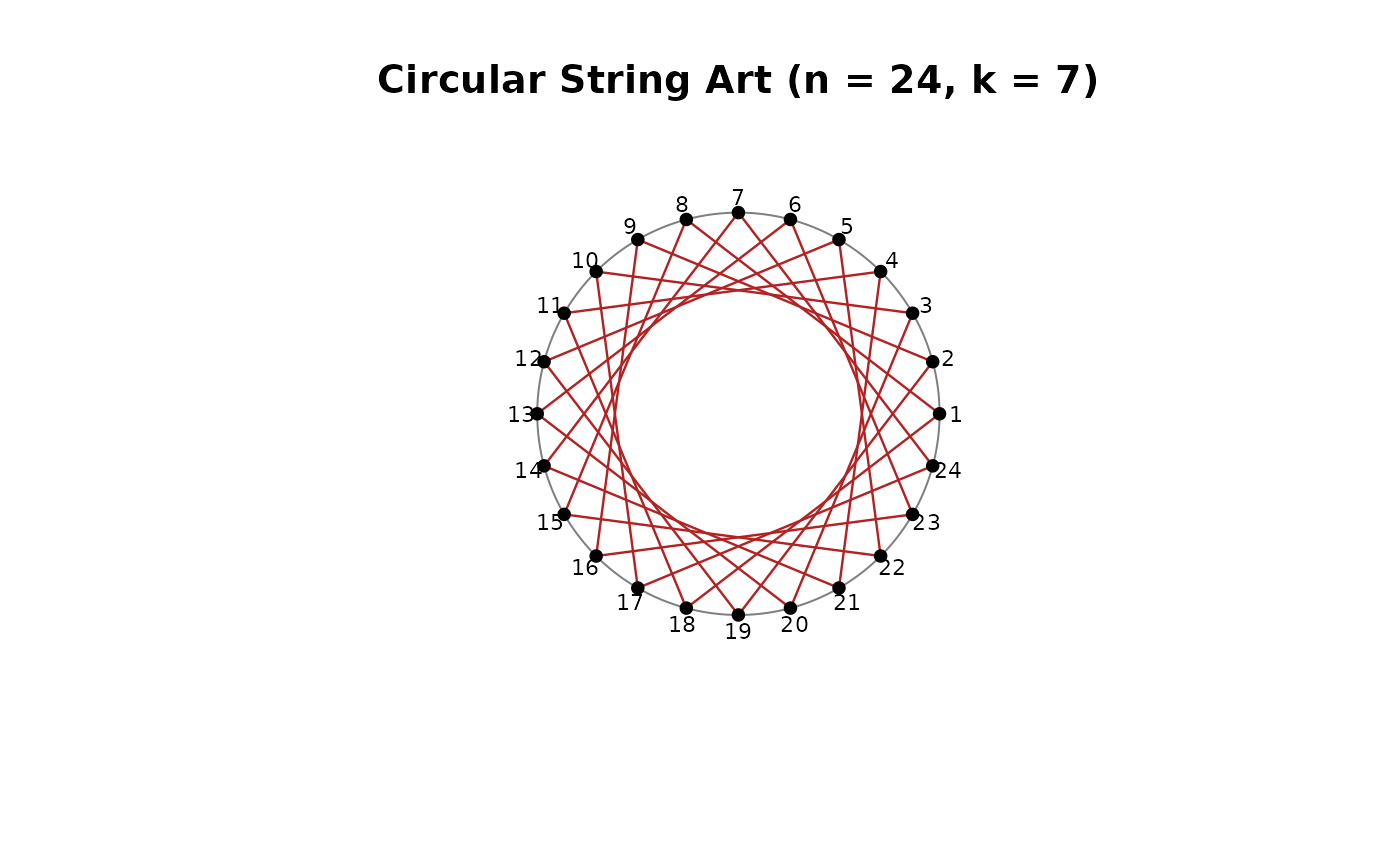
stcircle(n = 24, k = 7, col = "firebrick", lwd = 1.2,
show_points = TRUE, show_labels = TRUE)
res <- stcircle(plot = FALSE)
res$total_length
#> [1] 30
head(res$connections)
#> connection_index from to x_from y_from x_to y_to length
#> 1 1 1 6 1.0000000 0.0000000 0.5000000 0.8660254 1
#> 2 2 2 7 0.9781476 0.2079117 0.3090170 0.9510565 1
#> 3 3 3 8 0.9135455 0.4067366 0.1045285 0.9945219 1
#> 4 4 4 9 0.8090170 0.5877853 -0.1045285 0.9945219 1
#> 5 5 5 10 0.6691306 0.7431448 -0.3090170 0.9510565 1
#> 6 6 6 11 0.5000000 0.8660254 -0.5000000 0.8660254 1
stcircle(n = 24, k = 7, col = "firebrick", lwd = 1.2,
show_points = TRUE, show_labels = TRUE)
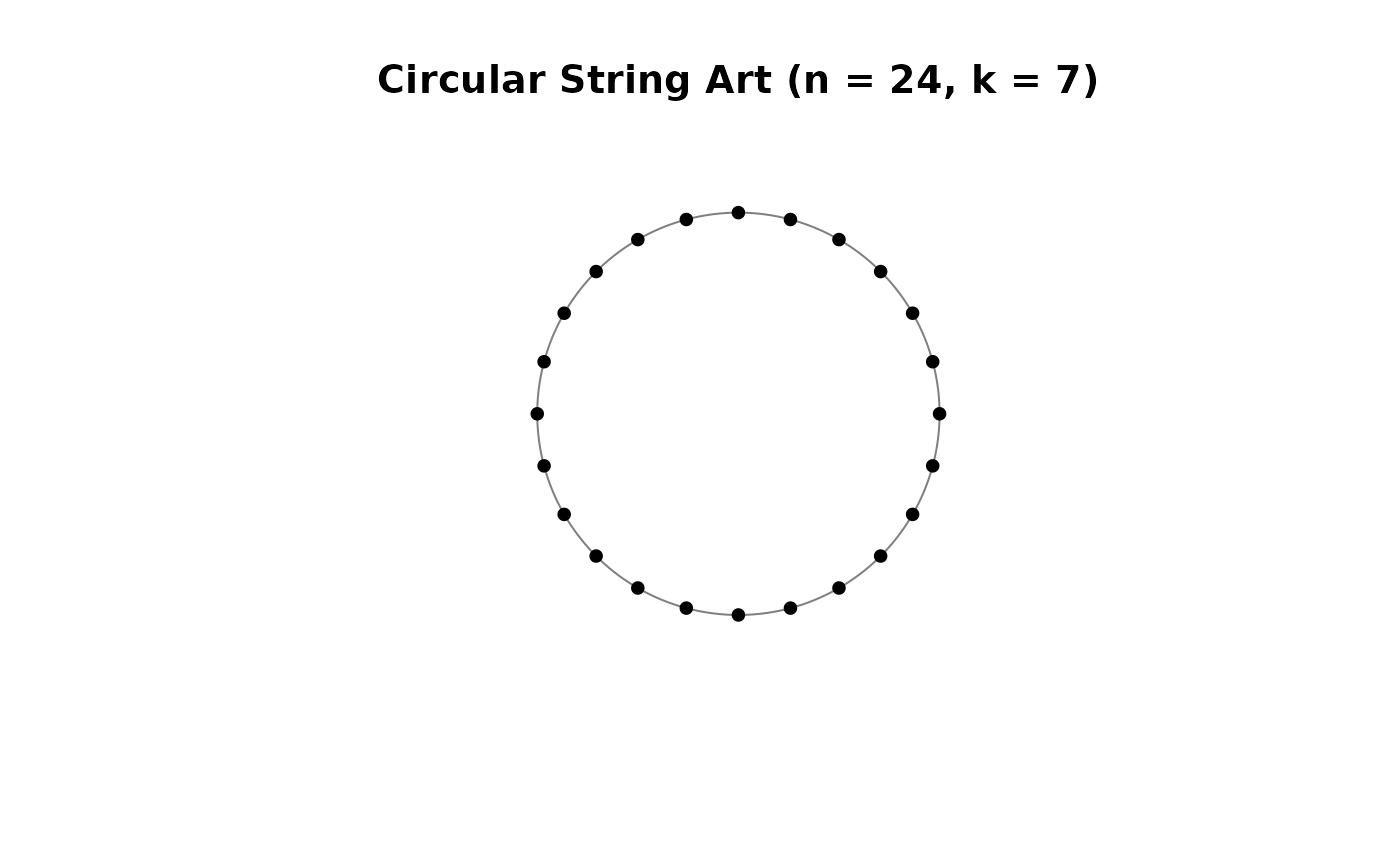
 stcircle(n = 24, k = 7, template = TRUE)